How to Create a Dashboard in Salesforce
Salesforce enables users to generate Reports to show data with defined filters, sorting, and groupings. Salesforce Reports can be further visualized using Salesforce Dashboards to create a canvas comprised of multiple reports, dashboard components, and dashboard widgets to present a 360-degree, comprehensive view of the data for analysis in real-time.
In this guide, we will delve into how to create a dashboard in Salesforce using the drag-and-drop Dashboard Editor. We will also cover the key steps on how to filter a Salesforce Dashboard and more.
Step-by-Step Process On How to Create a Dashboard in Salesforce
Building a Dashboard in Salesforce involves a few quick and easy steps. Here is a step-by-step guide on how to create a Dashboard in Salesforce:
Step 1: Access Your Salesforce Account
- Log into your Salesforce account with your username and password.
Step 2: Create a New Salesforce Dashboard
- Click on the Dashboards tab
- Click “New Dashboard” located in the top-right corner.
Step 3: Name the Dashboard
- In the New Dashboard pop-up window, name and describe the dashboard.
- Select the folder you would like to save it to for organizing or sharing.
- Click “Create.”
Step 3: Add components to the Dashboard
- Click “+” Widget located in the top-right corner.
- Select the source Report you want to visualize, then click “Select” (Note: You must have a source report generated to build a dashboard).
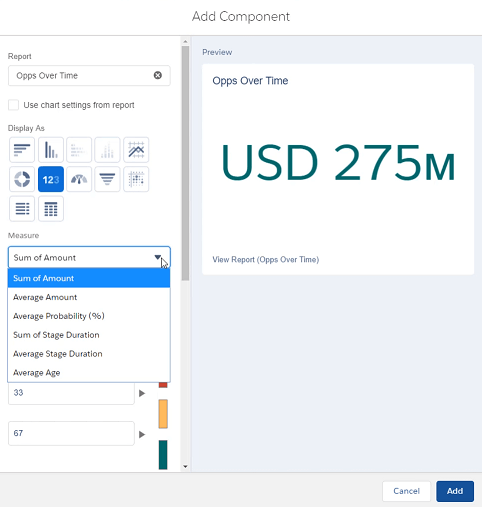
- Customize the way you would like the widget to display data by choosing between the various available chart options.
- Choose additional customization options such as measure, display units, title, footer, display colors, and more.
- Once done, click “Add.”

Step 4: Arrange Widgets In The Dashboard
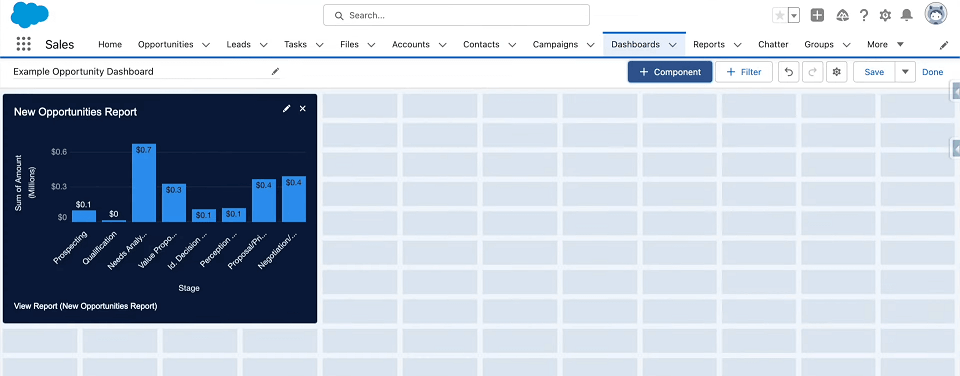
- Arrange and resize the widget as necessary.
- To edit an existing widget, click the pencil icon. To remove a widget, click the x icon.
Step 5: Add Filters to the Dashboard
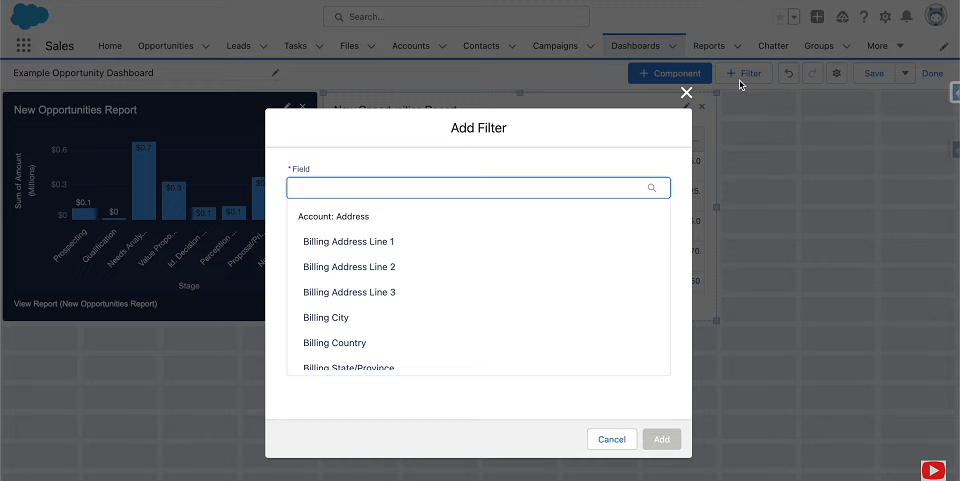
- To add filters, click “+ Filter” located in the top-right corner.
- From the dropdown menu, select a field to filter on.
- Give the filter a display name.
- Click “Add Filter Value” to assign values to the filter.

Step 6: Specify Permissions To View The Dashboard
- To specify how the dashboard looks to different people, click the cog icon in the top-right corner to open the properties menu.
- Under “View Dashboard As”, choose the people you want to view the dashboard and source reports and how much data you want to share.
- Click “Save.”
Step 7: Save the Dashboard
- Once all the dashboard components are added, click “Save.”
- Once you are happy with your dashboard, click “Done.”

Users can view the data in real-time by clicking “Refresh” to view the updated dashboard results.
Tips & Tricks
Here are some tips you can follow when creating a dashboard in Salesforce:
- You can customize the look and feel of your dashboard by opening the Properties menu and clicking the cog icon in the top right corner. Users can customize the theme and choose from 14 color palettes.
- You can switch between a 12-column and 9-column layout using the Properties menu to highlight certain data and focus on fewer items.
Wrapping Up
Creating a Salesforce Dashboard allows you to visually organize, curate, and showcase data in an easy-to-consume way. Using source reports, filters, and widgets, this valuable feature provides a graphical representation of the data that matters most and empowers users to monitor, measure, and visualize their real-time data with ease.
If you follow the steps on how to create a dashboard in Salesforce and incorporate these helpful tips and trips, you will be effectively and masterfully creating dashboards for a wide variety of use cases throughout your career.


